



Validate a sensor in the assembled device, under the conditions in which its readings will be used. Define the physical quantity and acceptable error, compare the complete measurement path with a suitable reference, and include uncertainty in the acceptance decision. Repeat the comparison across operating modes and test how quickly the product follows a changing input.
Consider an ambient-temperature monitor that reads correctly on an open development board but reports a warmer room after the enclosure is fitted and the radio becomes active. That hypothetical problem could involve sensor placement, heat flowing through the PCB, software compensation or the test arrangement itself. Buying a sensor with a tighter accuracy specification would leave several of those possibilities unresolved.
For founders and engineering teams developing connected hardware, the useful outcome is a defensible statement about the finished measurement: what it represents, where it has been tested and which decisions it can support.
Define the measurement before choosing the tolerance
Write down exactly what the product is supposed to measure. Air temperature beside an enclosure, the temperature of a component inside it and the average temperature of a room are different quantities. Identify the location, range, installation orientation and conditions that make a reading meaningful.
Then connect the measurement to its use. A display intended to show a slow trend may have different error and response requirements from an alarm. Specify the maximum acceptable error and the time available to detect a relevant change. Keep protective or safety-critical functions subject to their own engineering assessment; this guide does not qualify a sensor for them.
For a project in Lebanon, the Gulf or elsewhere in MENA, gather the conditions at the intended installation. A sun-exposed outdoor enclosure and an indoor wall-mounted device need different investigations. Record the actual environment instead of treating a regional label as a test specification.
Follow the physical path to the reported value
Sketch the path from the quantity of interest to the value the user sees: physical coupling, sensing element, electronics, conversion, compensation and display. Each stage can affect the result. For an analog sensor, include the signal-conditioning circuit and ADC. For a digital sensor, check the measurement mode and conversion rules even though the interface already returns a number.
Placement can change what the sensor measures
Texas Instruments’ PCB guidelines for temperature sensors distinguish ambient-air measurement from monitoring a nearby hot component. For ambient sensing, heat conducted from other components through the board can shift the reading. Component monitoring instead needs an appropriate thermal path to the component of interest. The layout should follow the measurement objective.
Check the enclosure as part of that path. Sensirion’s humidity and temperature sensor design guide explains how local conditions, internal heating and coupling to the device’s thermal mass influence measurements and response. It also shows that operating-mode changes, including charging or higher power consumption, can change the heating experienced by a sensor.
Use these mechanisms to plan comparisons: enclosure open and closed, idle and active operation, and the intended mounting arrangement. These are diagnostic experiments. The final acceptance test must use the configuration the product will actually have.
Keep the stages observable
Where practical, log the sensor output before compensation alongside the converted value and the final displayed or transmitted value. Record settings and timestamps. This makes it possible to locate a discrepancy without guessing whether it arose in the physical measurement, a conversion or a later software layer.
For units, validity and data meaning between those layers, see the hardware and firmware interface checklist. Here, the additional question is how closely the reported value represents the physical quantity under test.
Build a comparison that can resolve the question
Choose a reference instrument suitable for the quantity, range and intended uncertainty. Review its calibration information, relevant corrections, operating conditions and stability. A second uncharacterized sensor can reveal disagreement, but it cannot establish which reading is closer to the intended quantity.
NIST’s metrological traceability guidance connects measurement results to a documented chain of calibrations, with uncertainty contributed along that chain. Traceability alone does not establish fitness for a particular purpose. The uncertainty must also be small enough for the decision being made.
The setup matters as much as the reference label. Position the reference so it represents the same defined quantity without materially changing the device’s environment. Document separation, airflow and any temperature gradients. A chamber’s displayed setpoint does not by itself establish the temperature at the device. Allow the specified settling period and preserve the actual reference readings during the comparison.
Distinguish calibration, adjustment and verification in the records. Calibration establishes the relationship between indications and reference values, including uncertainty. Adjustment changes the instrument or its correction. Verification checks a defined requirement. NIST’s discussion of measuring-system characterization explains why these activities and their records should not be treated as interchangeable.
If the team changes a correction after seeing the data, preserve the original readings and correction. Check the revised behavior at additional conditions that were not used to select the correction. A single offset fitted at room temperature needs evidence before it can be applied across a wider range or a different power mode.
Separate offset, variation and response time
At each stable test condition, calculate estimated error as the device indication minus the corrected reference value. Preserve repeated observations so the team can inspect both the average difference and the spread. State whether the requirement applies to individual reported samples or an average over a defined interval.
A small spread can coexist with a consistent offset. More averaging does not remove a stable placement error. Conversely, a mean close to the reference can conceal individual readings that are too variable for the intended decision.
NIST’s measurement uncertainty guidance treats uncertainty as a property of a particular result and measurement configuration. Relevant contributions can include the reference, repeatability, changes over time and systematic effects. Prepare an uncertainty budget appropriate to the comparison, with assumptions and any correlations identified. Do not substitute a datasheet accuracy limit or the observed sample spread for that whole budget.
Test changing inputs separately. Record how long the assembled device takes to produce the response the application requires, including sensor behavior and software filtering. A fast reporting interval can still deliver slowly responding measurements. Use the actual input trace as well as the output trace, and define the response criterion before judging the result. Account for the reference sensor’s own response time so the comparison does not hide the device’s lag.
A hypothetical acceptance decision near the limit
Hypothetical example: a team is developing an indoor ambient-temperature monitor. For one defined, stabilized test condition, it sets an error limit of plus or minus 0.50 °C. Assume its comparison has an expanded uncertainty of 0.20 °C, supported by a documented budget and stated coverage. These numbers are illustrative choices, not sensor specifications, MakersGround measurements or Gomicron results.
Before testing, the team chooses a conservative development rule: accept that test point only when the entire stated uncertainty interval around the estimated error lies within the permitted error limits. JCGM 106:2012 on uncertainty in conformity assessment discusses acceptance intervals and guard bands. The particular rule here is an example; the applicable decision rule and risk must be agreed for the real product.
- Estimated error +0.20 °C: the interval is 0.00 °C to +0.40 °C. It fits within the limits, so this test point meets the example’s rule.
- Estimated error +0.40 °C: the interval is +0.20 °C to +0.60 °C. It crosses the upper limit, so the point is not accepted under this rule even though the estimated error is below +0.50 °C.
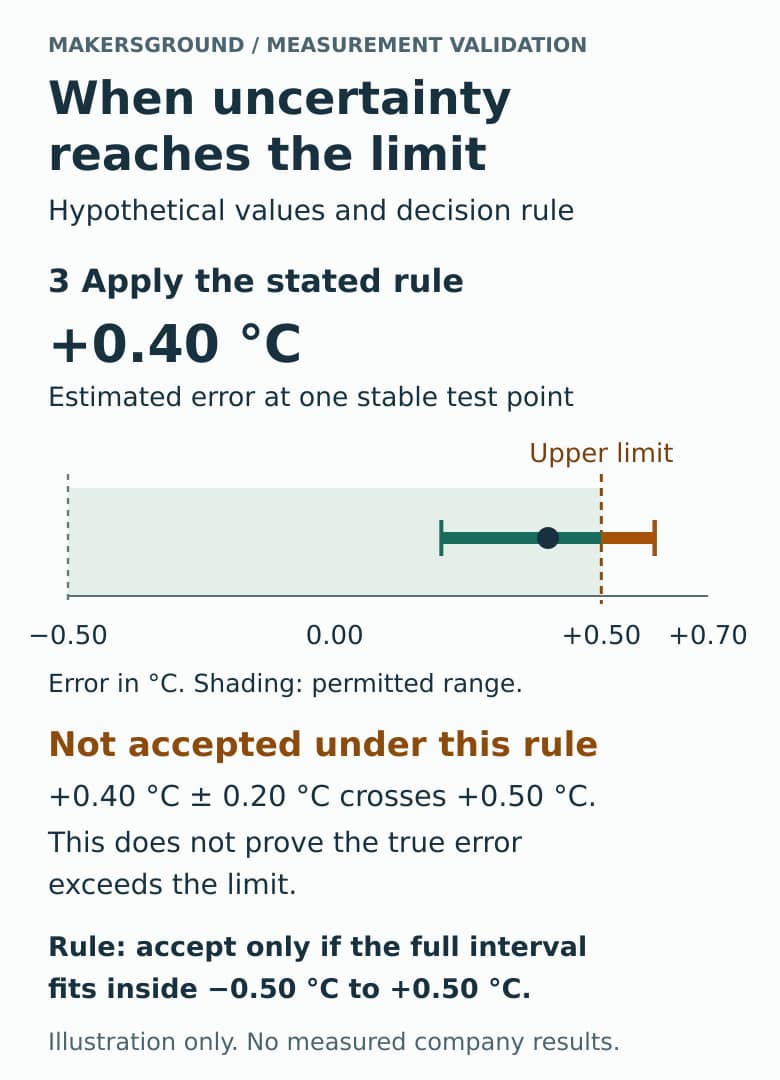
The second case needs a decision: investigate the device, improve the comparison where justified, or retain the unresolved result. It does not prove the true error exceeds the limit. Neither case establishes performance at other temperatures, in another enclosure or on every unit built. An uncertainty interval describes stated coverage, rather than an absolute guarantee.
Use failures to choose the next experiment
If a discrepancy appears only during radio activity, compare otherwise matched runs with different radio duty cycles. If it follows enclosure closure, investigate thermal coupling and airflow. If the raw value agrees while the displayed value differs, inspect conversion, correction and rounding. Change one suspected influence at a time where practical, then retest the integrated configuration.
Extend coverage deliberately. Select test points near decision thresholds and across the intended range. Include relevant power modes and mounting conditions. Compare multiple physical units when the question concerns unit-to-unit variation, and repeat measurements over time when stability matters. Record the units and repetitions actually tested without turning a small development study into an unsupported reliability claim.
Keep the unit identifier, PCB and enclosure revisions, firmware, sensor configuration, corrections, reference details and test conditions together with the data. The prototype revision checklist explains how to connect a physical build with its design records. A later enclosure or firmware change should trigger a review of which measurement results still apply.
Where the engineering disciplines meet
Measurement quality involves mechanical placement, electronics and software together. MakersGround’s historical Gomicron 3D printer engineering record documents our work across mechanical design, PCB electronics, firmware and control, slicing software, prototyping and manufacturing. Its original CAD, board and software material provides evidence of that integrated scope.
The project record does not publish a sensor calibration method or measurement-validation results. The approach described here is general engineering guidance. For a new product, the responsibilities across electronics and PCB development, mechanical integration and embedded firmware should be defined around the actual measurement requirement.
What the evidence should let you say
A useful validation record lets another engineer identify:
- The quantity, location, range and operating conditions covered.
- The reference, comparison method and uncertainty behind the result.
- The observed error, variation and response of the identified device configuration.
- The acceptance rule, results and conditions still untested.
- The changes or further tests needed before relying on the measurement.
That record gives the next design decision a concrete basis. It can justify retaining the sensor, relocating it, changing the enclosure, revising compensation or improving the test setup. The choice should follow the observed source of error.
Technical references and linked project evidence checked on 8 October 2026. The temperature-monitor scenarios and numerical examples are hypothetical.